
UK’s Dirtiest Public Toilets 2026: Which Cities Rank Worst?
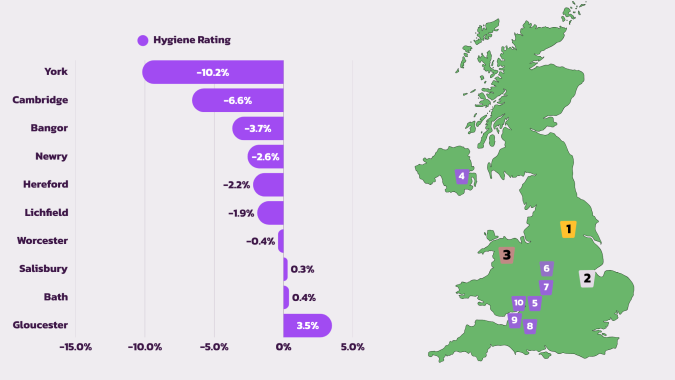
York has been named the UK city with the dirtiest public toilets for the second year running. With a hygiene score of -10.2/100, a year-on-year decline of 8.7%, and 32.5% mentions of ‘dirty’ in its Google reviews, the North Yorkshire city retains its crown.
A year on from our original analysis, Business Waste researchers have gathered data on 742 public toilets through 10,432 Google reviews, comparing mentions of cleanliness and dirtiness, average ratings, entry costs and year-on-year hygiene scores. Our hygiene score compares positive and negative cleanliness mentions and adjusts for review volume so cities with only a handful of reviews do not automatically dominate either end of the ranking.
The British Toilet Association estimates that around 3,300 public toilets remain, a 25% decrease since 2008. Maintaining clean facilities is particularly relevant for disabled people, those with medical conditions and young families.
So, what’s changed since 2025?
Key takeaways
- York ranks worst for the second year running, with a hygiene score of -10.2/100.
- Cambridge rises to second, with only 6.3% average clean mentions and a hygiene score of -6.6.
- Six cities are new to the bottom 10 compared with last year’s ranking.
- Hereford records the biggest hygiene-score fall among this year’s bottom 10, down 33.1 percentage points.
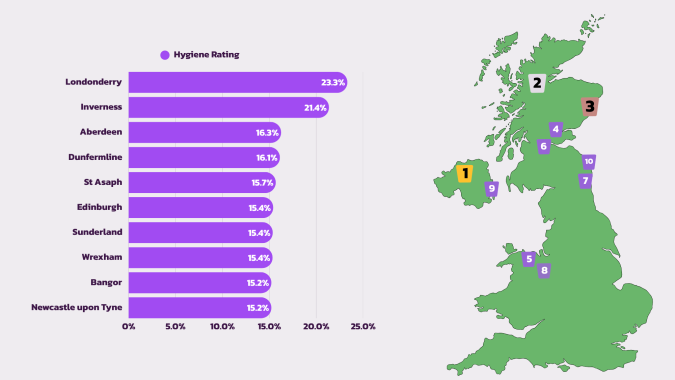
- Derry/Londonderry ranks cleanest, although its result is based on a very small review sample.
- Several paid facilities also perform poorly, including St Leonard’s Place in York and the Cutty Sark facilities in London.
- Note: rankings are based on Google Review data, rather than physical inspections.
The UK cities with the dirtiest public toilets in 2026
York has the UK’s dirtiest public toilets for a second year
Taking the top spot for a second consecutive year is York, with a hygiene score falling from -1.5 to -10.2. 433 reviews were recorded, providing a strong evidence base. Of these, 32.5% mentioned dirty facilities.
Five of the 11 facilities charge for entry; St Leonard’s Place charges 50p per customer and has an average rating of 1.7/5 on Google. Complaints mention smells, flies, missing soap and broken hand dryers. Interestingly, London had far more toilets in the dataset, yet York’s reviews were more than twice as likely to describe facilities as dirty.
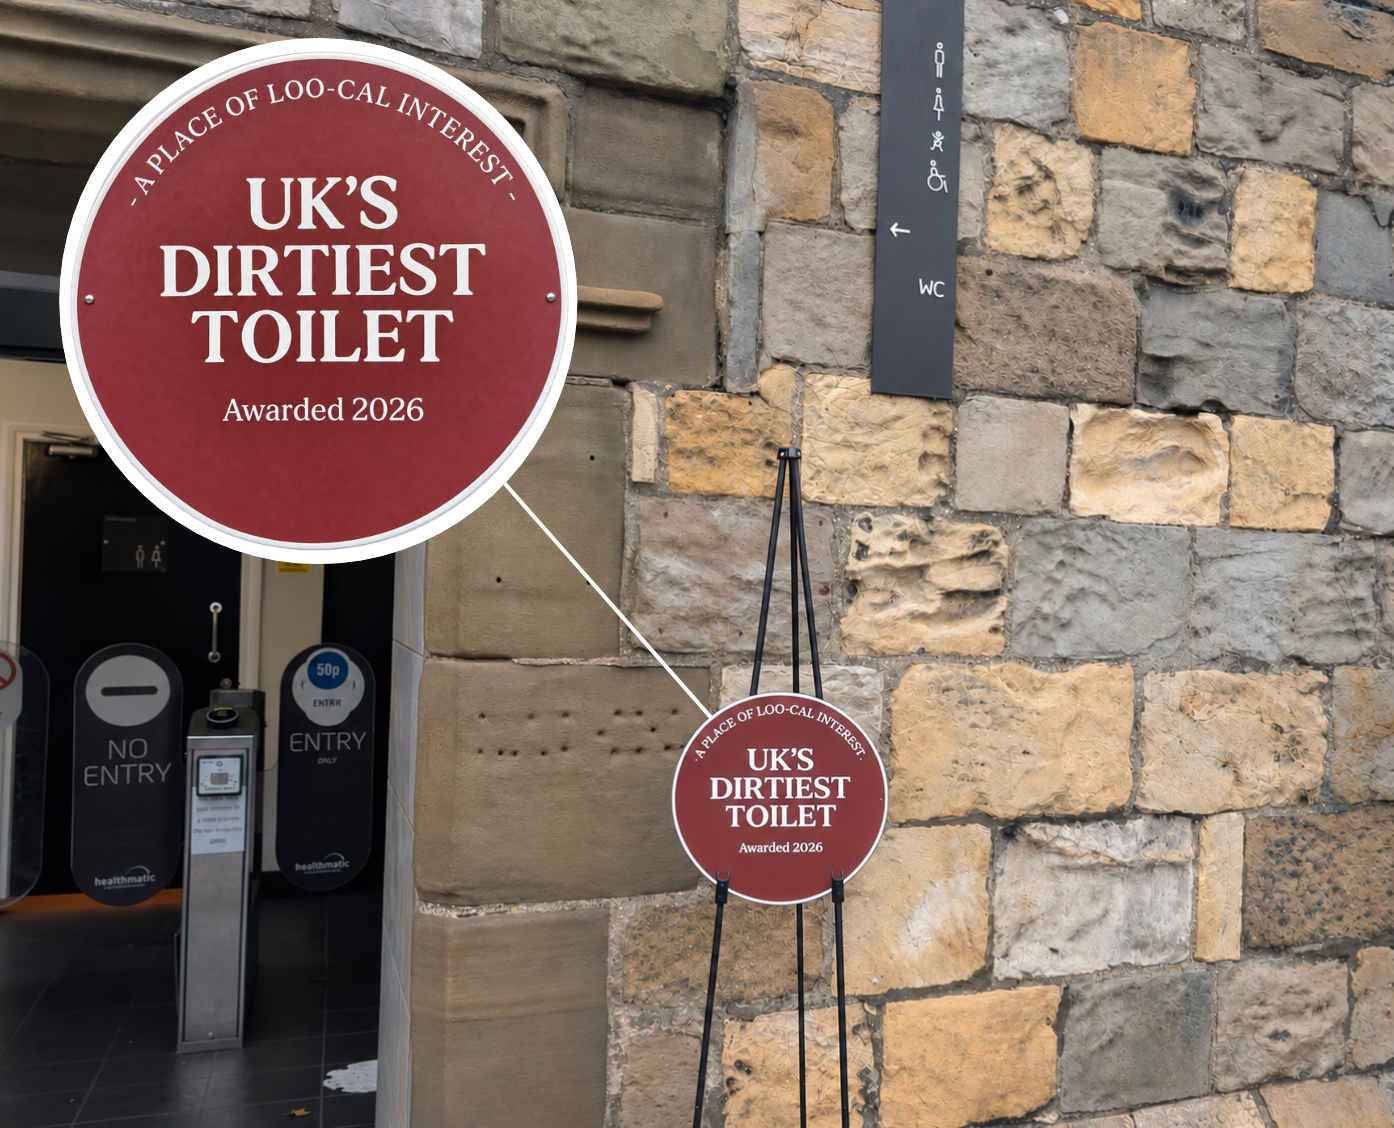
A brown plaque (pictured below) has been unveiled outside St Leonard’s Place, York, commemorating the negative reviews received.
Cambridge moves into second place
Eight toilets are available to the public, with 164 reviews returning an average rating of 2.6/5. A hygiene score of -6.6 represents a 15.1% fall from a 2025 rating of 8.5.
One review mentioned a “missing toilet seat”, while graffiti, a broken hand dryer and drug use were also noted. Cambridge is not just ranking badly because of one unusual complaint. Its score has worsened year-on-year.
Bangor enters the bottom three
Bangor was the third dirtiest collection of public toilets, according to our methodology. A hygiene rating fall of 30.2% is compounded by 37.5% average ‘dirty’ mentions.
Bangor has a much smaller sample than York or Cambridge, so the result should be read with that in mind, even though the smoothing methodology reduces the effect of small samples.
How the rest of the bottom 10 performed
4th: Newry
- -2.6 score.
- Only 3 reviews.
- 2 mentioned dirtiness, so a very small sample.
5th: Hereford
- Fell from 30.9 to -2.2.
- 33.1-point decline, largest among this year’s bottom 10.
- Only 7 reviews and one toilet.
- Lichfield charged 30p per use, averaging 1.8/5 on Google.
- Worcester also charged at three of their four facilities, averaging 1.7/5 on Google.
- 20 dirty mentions compared to nine clean mentions.
- Sanitary waste, lack of bins and lack of toilet roll were mentioned.
- Second worst in 2025, now ninth, so a marked improvement.
- However, it still has considerable negative feedback and numerous paid facilities.
- 3.5 hygiene score, down from 28.2 in 2025.
- Only 17 reviews were submitted.
What has changed since our 2025 public toilet ranking?
Bangor, Newry, Hereford, Lichfield, Worcester and Gloucester are new to the bottom 10, while York (1st to 1st), Cambridge (3rd to 2nd), Salisbury (8th to 8th) and Bath (2nd to 9th) remain.
The biggest declines in hygiene score were recorded by Hereford (-33.1), Lichfield (-30.7), Bangor (-30.2), Worcester (-26.6), Salisbury (-16.8) and Cambridge (-15.1).
A fall in hygiene score does not necessarily mean every physical toilet has become dirtier. The scores reflect the Google Reviews captured in each year’s dataset, so new reviews and changes to the facilities represented can affect the result.
Last year’s bottom 10:
- York
- Bath
- Cambridge
- London
- Bristol
- Oxford
- Nottingham
- Salisbury
- Cardiff
- Brighton & Hove
This year’s bottom 10:
- York
- Cambridge
- Bangor
- Newry
- Hereford
- Lichfield
- Worcester
- Salisbury
- Bath
- Gloucester
Which UK cities have the cleanest public toilets?
A quick 2025 comparison:
- Sunderland ranked first last year, but sits seventh in the 2026 top 10.
- Derry/Londonderry moves from eighth to first.
- Inverness remains near the top, moving from second to second.
- Aberdeen moves from seventh to third.
- Edinburgh, Bangor and Newcastle enter the clean top 10.
Carlisle, Preston and Leeds drop out.
Does paying for a public toilet mean it will be cleaner?
You might expect an entrance charge to fund better-maintained facilities, but the paid toilets in our dataset did not consistently perform better than free alternatives. For instance, Cutty Sark in London charges 50p per use, yet returns an average Google Review rating of 1.8/5. 2theloo in Covent Garden, London, charges £1.50 per use and has a 2/5 average Google review rating.
However, certain public toilets, such as Changing Places, Embankment, London, buck the trend. This facility charges 80p per use and has just one dirty mention in 56 reviews. Charging itself clearly isn’t the determining factor. The contrast suggests that what matters is how effectively those facilities are cleaned, maintained and managed.
What are people complaining about in public toilets?
Our research unearthed complaints involving used needles, overflowing sanitary bins, broken hand dryers, missing toilet roll and more. Three themes continued to appear.
Waste facilities
Overflowing sanitary bins and waste left on floors indicate that cleaning and waste-collection schedules may not match actual use.
Sharps and drug-related litter
Used needles create obvious risks to members of the public, cleaners and waste handlers. They require an appropriate sharps disposal route, rather than being placed into sanitary or general waste bins.
Basic hygiene and maintenance
Repeated complaints mention missing soap and toilet roll, broken hand dryers, bad smells and broken fixtures. It’s clear that cleanliness goes beyond visible dirt.
Maintaining a public toilet therefore requires more than periodic cleaning. Sanitary waste collections, consumable checks, sharps procedures and responsive maintenance all affect how safe and usable a facility feels.

“Seeing our own city, York, remain at the bottom for a second year is concerning, but the broader change is just as important. Public toilets are an essential service for many disabled people, older people and those with medical conditions, so poor maintenance can become an accessibility issue rather than simply an inconvenience.”Mark Hall, Co-Director,
Business Waste
Why clean, accessible public toilets still matter
Cleanliness and availability matter disproportionately to disabled people, those with certain medical conditions, elderly people, parents with young children and those who spend the day travelling. A drop to around 3,300 public toilets increases the importance of keeping the remaining facilities usable.
Our analysis suggests cleanliness is not just about cleaning frequency. Waste collection, stocked handwashing facilities, maintenance, and safe handling of sanitary and sharps waste all contribute to whether a public toilet remains usable.
Speak to our team today to find out more about washroom waste services and arranging suitable collections.
Methodology
To identify the UK cities with the cleanest and dirtiest public toilets, Business Waste analysed public toilet listings and Google Review data from across the UK.
A total of 742 public toilets and 10,432 reviews were included in the study. Duplicate listings and toilets located inside businesses were removed so the analysis focused on publicly accessible facilities.
For each toilet listing, we collected:
- The number of Google reviews
- Average Google rating
- The number of reviews mentioning the word “dirty”
- The number of reviews mentioning the word “clean”
- Whether the toilet charged for entry
- The recorded entry price, where available
Reviews that were judged not to be serious or relevant were excluded from the analysis.
How the hygiene score was calculated
We calculated a hygiene score based on the balance between positive and negative cleanliness mentions.
For each city, we compared the percentage of reviews mentioning “clean” with the percentage mentioning “dirty” to create a net cleanliness score.
We then adjusted these scores to account for the number of reviews available. This prevents a city with only a handful of reviews from being ranked as extremely clean or dirty based on one or two comments.
Cities with larger review samples retain more of their observed cleanliness score, while those with smaller samples are pulled closer towards the average across the full dataset. The same adjustment was applied when assessing individual public toilets.
The final results were ranked from highest to lowest:
- A higher hygiene score indicates that reviews were more likely to mention cleanliness.
- A lower hygiene score indicates a greater proportion of negative cleanliness feedback.
- A negative hygiene score means mentions of dirtiness outweighed mentions of cleanliness after the review-volume adjustment was applied.
The hygiene score is based on the Google Reviews analysed and should therefore be viewed as an indication of reported visitor experience rather than a physical inspection or independent hygiene assessment.
Comparing results with 2025
The same ranking approach was used to compare 2026 results with the previous study.
Where available, we calculated the percentage-point change in hygiene score between 2025 and 2026. We use percentage-point movement rather than percentage change in the article because some scores are close to zero or have moved between positive and negative values, which can produce misleadingly large percentage changes.
Changes between the two studies may reflect new reviews, changes to the facilities represented in Google Maps and shifts in visitor feedback. A fall in a city’s score does not necessarily mean that every public toilet within that city has physically deteriorated.
Geographic adjustments
Some locations were combined where the urban areas overlap:
- Manchester and Salford
- Newcastle and Gateshead
- Wells and Bath
Westminster was included within the wider London data rather than treated as a separate city.
Where a city had only a small number of reviews, this is highlighted in the article so its ranking can be interpreted alongside the size of the available sample.
The full dataset, including all cities and metrics analysed, can be viewed here.


Have your waste collected
Get a fast FREE quote for your waste collection 0800 211 83 90
- Free quote within 1 hr
- Any type of waste
- FREE bins and delivery
- We cover all of the UK